
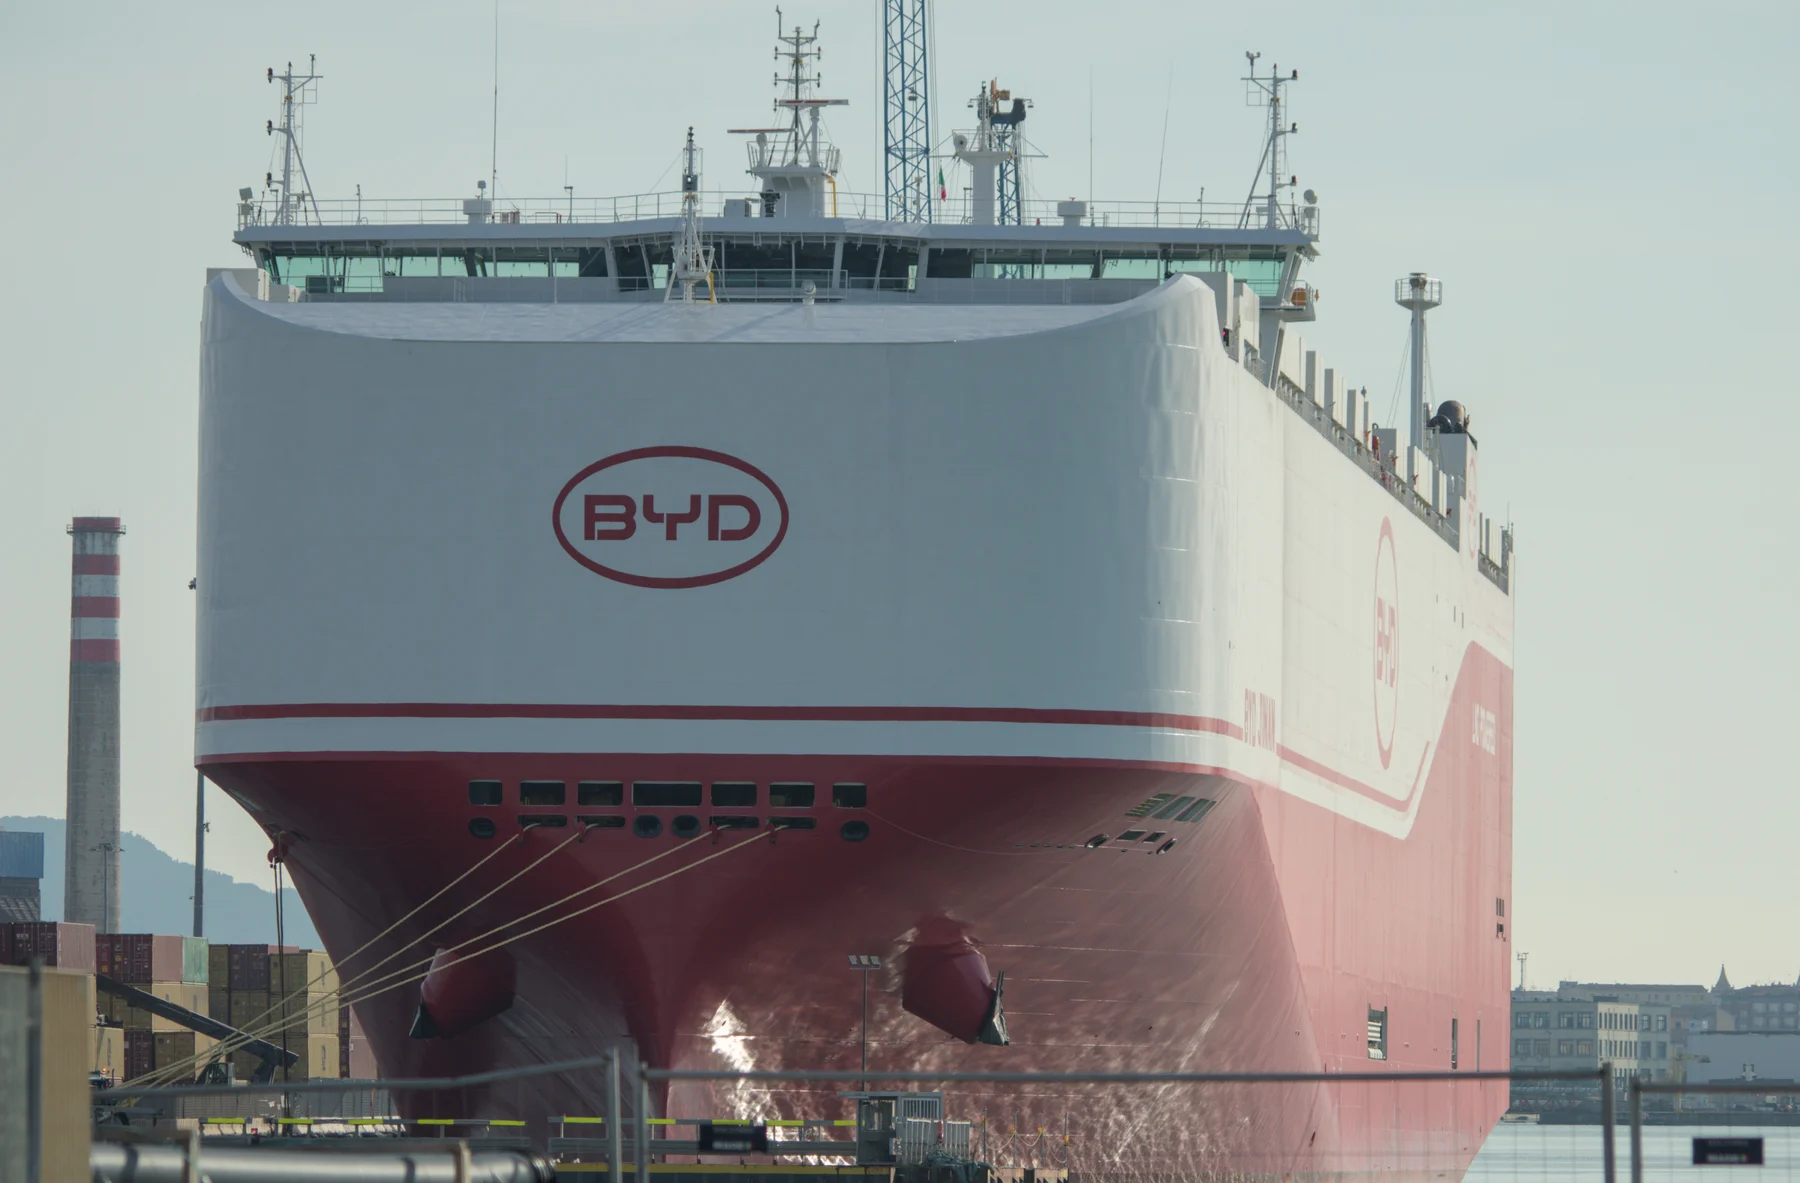

China exported approximately 5.096 million vehicles in the first half of 2026, an increase of 65.3% year on year, according to a report by Zheng Xueqin in the August 2026 issue of Auto Review (汽车纵横), which cites the China Association of Automobile Manufacturers (CAAM).
June marked another milestone: monthly exports reached 1.037 million vehicles, up 75.1% from a year earlier and, according to the report, the first monthly total above one million. Passenger vehicles remained the largest export category, while new energy vehicles (NEVs) accounted for an increasingly important share of shipments.
The figures cover China-manufactured vehicle exports. They should not be read as a separate measure of used-car exports, Chinese-brand-only exports, or Yanxun Car’s sales.
Passenger vehicles account for most exports
Passenger vehicle exports reached 4.4321 million units in January–June, compared with 664,000 commercial vehicles. SUVs were the largest passenger vehicle segment at 3.2493 million units, followed by sedans at 1.0796 million.
Calculated from the publication’s figures, SUVs represented approximately 73.3% of passenger vehicle exports in the first half. Conventional-fuel vehicles still accounted for more than half of cumulative exports, even as NEVs moved ahead in June alone.
Table 1. China-manufactured vehicle exports by category
Volumes are in vehicles, converted from the publication’s unit of 10,000 vehicles. The publication reports quantities to the nearest 100 vehicles; conversion does not imply unit-level precision.
| Category | June 2026 | January–June 2026 |
|---|---|---|
| Passenger vehicles: SUVs | 657,900 | 3,249,300 |
| Passenger vehicles: Sedans | 225,400 | 1,079,600 |
| Passenger vehicles: MPVs | 16,000 | 70,100 |
| Passenger vehicles: Microvans | 5,300 | 33,100 |
| Passenger vehicles: Passenger vehicle subtotal | 904,500 | 4,432,100 |
| Commercial vehicles: Complete trucks | 82,700 | 433,200 |
| Commercial vehicles: Complete buses/coaches | 18,000 | 83,600 |
| Commercial vehicles: Semi-trailer tractor units | 19,800 | 93,100 |
| Commercial vehicles: Incomplete trucks/chassis | 11,700 | 52,000 |
| Commercial vehicles: Incomplete buses/chassis | 300 | 2,100 |
| Commercial vehicles: Commercial vehicle subtotal | 132,500 | 664,000 |
| Energy type: Conventional-fuel vehicles | 513,900 | 2,740,700 |
| Energy type: New energy vehicles | 523,200 | 2,355,400 |
| All vehicles: Total exports | 1,037,000 | 5,096,100 |
Source: Table 1 in Auto Review, August 2026, citing CAAM. Vehicle-class and energy-type rows are alternative breakdowns of the same total and must not be added together. Subtotals and totals are retained as published; small differences between rounded rows and subtotals have not been silently adjusted.
NEVs reach 46.2% of first-half exports
China exported 2.3554 million NEVs during the first half, representing approximately 46.2% of total vehicle exports. In June, NEV shipments reached 523,200 units, slightly more than half of the monthly total.
Battery-electric vehicles (BEVs) contributed 1.4335 million exports in January–June, while plug-in hybrid electric vehicles (PHEVs) contributed 921,900. NEV passenger vehicles made up the overwhelming majority of the category, at 2.3019 million units.
Table 2. New energy vehicle exports by vehicle class and powertrain
Volumes are in vehicles, using the same conversion and precision as Table 1.
| Category | June 2026 | January–June 2026 |
|---|---|---|
| Passenger vehicles: Battery-electric | 301,500 | 1,404,400 |
| Passenger vehicles: Plug-in hybrid | 208,600 | 897,400 |
| Passenger vehicles: NEV passenger vehicle subtotal | 510,000 | 2,301,900 |
| Commercial vehicles: Battery-electric | 7,400 | 29,100 |
| Commercial vehicles: Plug-in hybrid | 5,700 | 24,500 |
| Commercial vehicles: NEV commercial vehicle subtotal | 13,100 | 53,500 |
| All vehicle classes: Battery-electric total | 308,900 | 1,433,500 |
| All vehicle classes: Plug-in hybrid total | 214,300 | 921,900 |
| All NEVs: Total NEV exports | 523,200 | 2,355,400 |
Source: Table 3 in Auto Review, August 2026, citing CAAM. Powertrain totals overlap with the passenger/commercial breakdown and must not be added to it. Values and rounded subtotals are retained as published.
Chery leads the export ranking
The publication reports that the ten largest exporters shipped approximately 4.511 million vehicles in the first half, accounting for 88.5% of the national total. Chery ranked first, followed by BYD and SAIC.
Table 3. Five largest exporters in the publication’s first-half ranking
| Manufacturer / group | January–June 2026 (vehicles) |
|---|---|
| 1. Chery | 939,200 |
| 2. BYD | 792,300 |
| 3. SAIC | 676,600 |
| 4. Geely | 585,000 |
| 5. Changan | 454,700 |
Source: the first five entries of Chart 4 in Auto Review, August 2026. This table follows the publication’s reporting scope; it is not a ranking assembled from manufacturers’ separate overseas-sales announcements.
A broader product mix for the international market
The first-half figures show two developments occurring together: China’s export volumes are growing strongly, and the powertrain mix is becoming more diverse. Conventional-fuel vehicles remain a substantial part of the market, while both battery-electric and plug-in hybrid vehicles contribute significant volumes.
For international buyers following China’s automotive supply market, the distinction matters. The headline growth is not limited to one powertrain, one body style or one manufacturer. At the same time, national export statistics do not establish the availability, condition or destination-market suitability of any individual vehicle.
Source and data note
This article is independently written from Zheng Xueqin’s “2026年上半年国产汽车出口量509.6万辆,” Auto Review (汽车纵横), August 2026, pages 114–115. The publication attributes its statistical tables to CAAM.
NEV year-on-year growth rates have deliberately been omitted from the tables above. The publication’s first-half NEV total growth rate of 109.86% does not reconcile with its BEV/PHEV component rates. China News Service’s July 9 report, also citing CAAM, reports approximately 120% growth. This article retains the publication’s export volumes without substituting an unverified exact growth rate. Its monthly chart has not been used to recalculate the published half-year total.